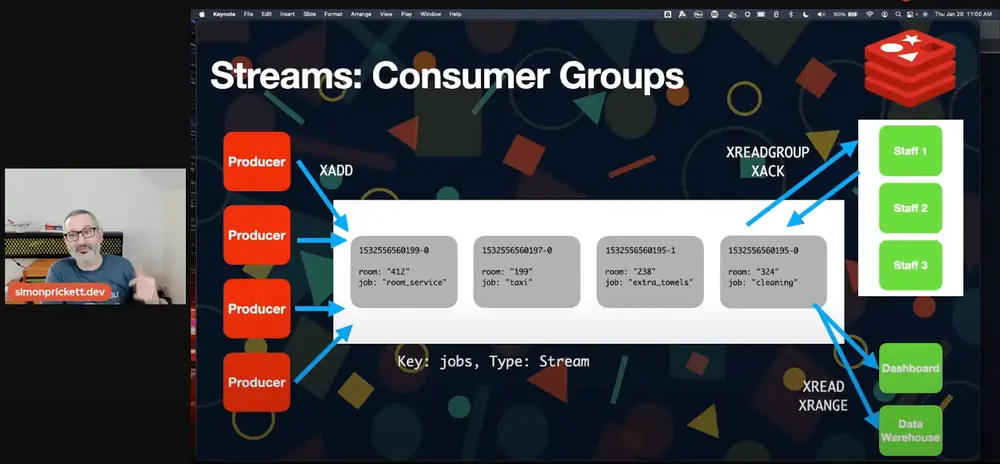
When working with streaming data or any sort of system where a data structure acts as a buffer or queue betwen producers and consumers, we often want to know how far behind the consumers are with processing the data stream. This is commonly referred to as the consumer lag.
In this project, I build a visual representation of the lag for a Redis stream using new features of the XINFO GROUPS command added in Redis 7.

This was the seventh project in my Things on Thursdays IoT live streaming series.
In this first of two episodes, I demonstrate how Redis Streams Consumer Groups work. We also look at how to determine the lag for a given consumer group using features added in Redis 7.
Your support helps to fund future projects!
In this second of two episodes for this project, I show you how to display a Redis Streams consumer group lag using MicroPython, a Raspberry Pi Pico W and some LEDs…
- Source code for this project on GitHub
- MicroPython/Redis/Pi Pico W boilerplate source code
- Source code for testing the LEDs
- Try out my free Redis Streams workshop
- RU202: Redis Streams, a free course at Redis University
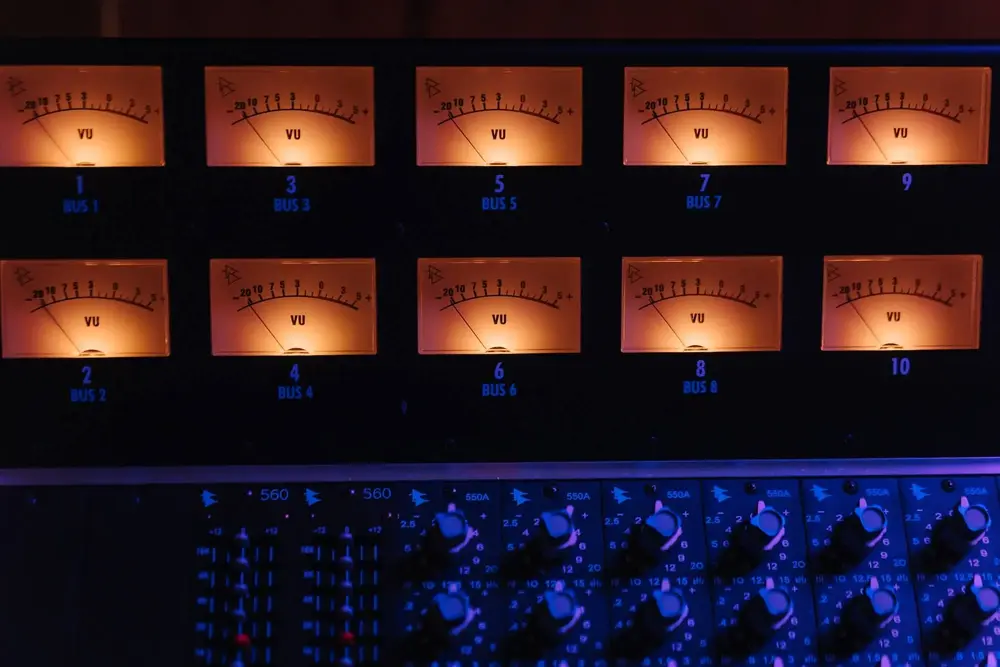
Main photograph by Cottonbro Studio on Pexels.
 Simon Prickett

 Hotel Room Service with Node RED and Redis on the Raspberry Pi