 Simon Prickett

At Conectric we recently launched our new IoT Gateway product with an accompanying suite of wireless, battery powered sensors. In this article we’ll take a closer look at how to use our temperature / humidity sensor and Node.js SDK to create a Grafana dashboard powered by Elasticsearch.
(If you missed it, you may wish to read our first article that provides an overview of all the components in the system).
We also produced a video run through of how to set up the temperature sensor with Elasticsearch and our Node.js SDK. The video shows this with Mac OS, but the same process applies on Windows and Linux too (including Raspberry Pi with Raspbian OS):
Let’s look at how to quickly get setup and running…
Hardware
The complete system currently includes a USB router and the following types of sensor:
- Motion
- Switch (door)
- Temperature / humidity
In this example use case we’ll be using both the USB Router and temperature / humidity sensor.
USB Router

The USB router acts as the gateway to the Conectric mesh network, receiving messages from the sensors and working with the open source Node.js SDK to translate these into JavaScript objects that you can use in your application code. It connects to a regular USB port on any computer and does not require an external power source.
Additional USB routers can be used to extend the mesh network’s range. These are powered from regular USB chargers and act as message repeaters. In this example, we’ll use a single router.
Temperature / Humidity Sensor

The temperature / humidity sensor works by periodically sending messages containing the current temperature and relative humidity. The message frequency is configurable. The SDK can be configured to return temperatures in either Fahrenheit or Celsius. It is battery powered and our testing indicates that the battery should last for years of normal usage.
Your support helps to fund future projects!
The casing allows for straightforward wall mounting of the sensor. For this demonstration we’ll use a single temperature / humidity sensor.
Software
There are three distinct pieces of software to configure here:
- We need to set up Elasticsearch and configure it to allow us to store message data from the sensor.
- We’ll have to implement a callback function for the Conectric SDK to tell it how to handle
tempHumiditymessages received from the sensor. - Finally, we need to configure a Grafana dashboard to poll Elasticsearch and visualize the data.
Elasticsearch Setup
Elastic provides a fully managed cloud service for their product stack, including Elasticsearch. This has a two week free trial period that is sufficient for this demonstration.
Having signed up for the trial, we simply create an Elasticsearch cluster using the default values:
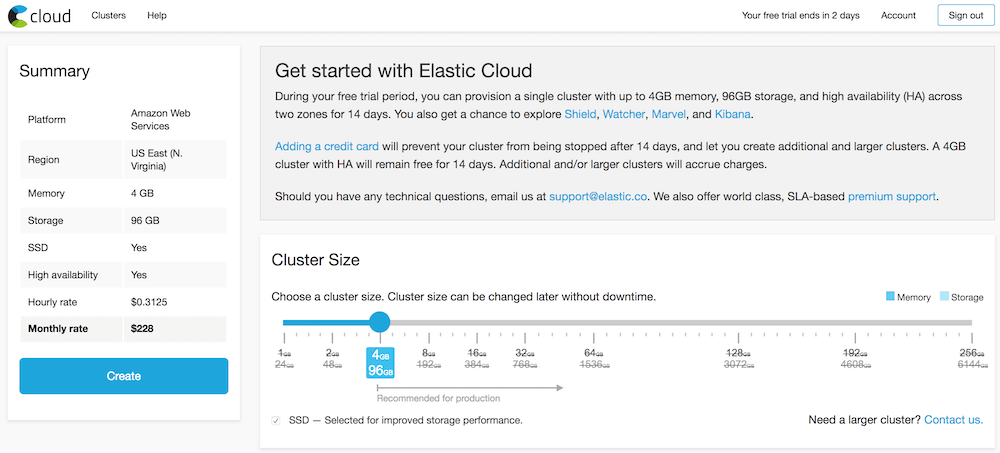
We need to keep note of the following items that will be needed later:
- Elasticsearch URL
- Elasticsearch port
- Username (will be “elastic”)
- Password
Conectric SDK & Callback Function Implementation
Conectric’s SDK can be found on npm. To use it simply install as you would any other package:
npm install conectric-usb-gateway
For this example we’re also sending data to Elasticsearch through its API, so let’s install the official Node.js client for that product:
npm install elasticsearch
The Conectric SDK works by allowing developers to provide their own onSensorMessage callback function when starting the gateway driver. This abstracts away the details of talking to the USB Router and mesh network thus freeing the developer to focus on application level logic instead.
Each time a message arrives the onSensorMessage callback is invoked and receives a JavaScript object containing message data. All messages have a type property — the temperature / humidity sensor sends messages of type tempHumidity having the form below:
{
  "type": "tempHumidity",
  "payload": {
    "battery": 3,
    "temperature": 73.33,
    "temperatureUnit": "F",
    "humidity": 60.65
  },
  "timestamp": 1518746385455,
  "sensorId": "a946",
  "sequenceNumber": 1
}
Each message’s payload contains the temperature and humidity readings from the sensor, an indicator of which scale the temperature is in (F/C) and an idea of the sensor’s current battery voltage. Additionally it includes a UNIX timestamp for when the message was received, the ID of the sensor that sent it and the sequence number of the message from that sensor.
Complete example code for processing temperature messages and storing them in ElasticSearch is included with the SDK. Let’s take a look at it and split it into two parts for ease of explanation:
// server.js
const gateway = require('conectric-usb-gateway');
const elasticsearch = require('elasticsearch');
const ELASTICSEARCH_URL = process.env.ELASTICSEARCH_URL;
const ELASTICSEARCH_USER = process.env.ELASTICSEARCH_USER;
const ELASTICSEARCH_PASSWORD = process.env.ELASTICSEARCH_PASSWORD;
const ELASTICSEARCH_PORT = process.env.ELASTICSEARCH_PORT;
if (! ELASTICSEARCH_URL || ! ELASTICSEARCH_USER ||
    ! ELASTICSEARCH_PASSWORD || ! ELASTICSEARCH_PORT) {
  console.error('Please set all of the following environment variables: ELASTICSEARCH_URL, ELASTICSEARCH_USER, ELASTICSEARCH_PASSWORD, ELASTICSEARCH_PORT');
  process.exit(1);
}
if ((! ELASTICSEARCH_URL.startsWith('http://')) && (! ELASTICSEARCH_URL.startsWith('https://'))) {
  console.error('The value of ELASTICSEARCH_URL must begin with http:// or https://');
}
const elasticSearchConnectURL = `${ELASTICSEARCH_URL.substring(0, ELASTICSEARCH_URL.indexOf('://') + 3)}${ELASTICSEARCH_USER}:${ELASTICSEARCH_PASSWORD}@${ELASTICSEARCH_URL.substring(ELASTICSEARCH_URL.indexOf('://') + 3)}:${ELASTICSEARCH_PORT}`;
const elasticClient = new elasticsearch.Client({
  hosts: [
    elasticSearchConnectURL
  ]
});
The initial pre-amble code loads the Conectric SDK and Elasticsearch client modules, checks that required environment variables containing connection credentials are set, then creates an Elasticsearch client.
Not shown here is some additional setup code to create an index in Elasticsearch should one not already exist. You can see the full code for this example on GitHub.
The remainder of the example code starts the Conectric SDK which waits for the USB router to be inserted. Having detected the router, it then waits for messages to arrive from the mesh network. Each message received (from any sensor type) causes the developer’s onSensorMessage callback to be invoked:
gateway.runGateway({
  onSensorMessage: (sensorMessage) => {
    if (sensorMessage.type === 'tempHumidity') {
      const d = new Date();
      console.log(`${d.toDateString()} ${d.toTimeString()} received message: ${JSON.stringify(sensorMessage)}`);
      elasticClient.create({
        index: 'temphumidityreadings',
        type: 'tempHumidityReading',
        id: `${sensorMessage.sensorId}-${sensorMessage.sequenceNumber}-${sensorMessage.timestamp}`,
        body: {
          battery: sensorMessage.payload.battery,
          temperature: sensorMessage.payload.temperature,
          temperatureUnit: sensorMessage.payload.temperatureUnit,
          humidity: sensorMessage.payload.humidity,
          sensorId: sensorMessage.sensorId,
          timestamp: (sensorMessage.timestamp * 1000)
        }
      }, (error, response) => {
        if (error) {
          console.error(
            `Error from Elasticsearch: ${JSON.stringify(error)}`
          );
        } else {
          console.log(
            `Sensor reading sent to Elasticsearch: ${JSON.stringify(response)}`
          );
        }
      });
    }
  },
  useFahrenheitTemps: true
});
The example callback implementation above works as follows:
- Whenever a message is received it checks the message type, ignoring any messages not of type
tempHumidity. - Data from each message is then sent to Elasticsearch to be added to the
temphumidityreadingsindex.
Note also that we configure the Conectric SDK to return temperature data using the Fahrenheit scale. The SDK also supports returning temperatures in Celsius.
Grafana Setup
Grafana is an open source platform for visualizing time series analytics. This makes it a good choice for building a temperature / humidity dashboard. It supports Elasticsearch as an underlying data source, and has a free hosted cloud version which is suitable for this demonstration.
Setting up a visualization is as simple as signing up at grafana.com, then configuring the Elasticsearch credentials and using the different dashboard widgets. When used with Elasticsearch, the data is retrieved using standard Lucerne query syntax. For example, to query data from a sensor whose ID is a946, we’d use the query:
sensorId:a946
For example to plot temperature over time, a graph control to show temperature over time in Grafana would be configured as shown:
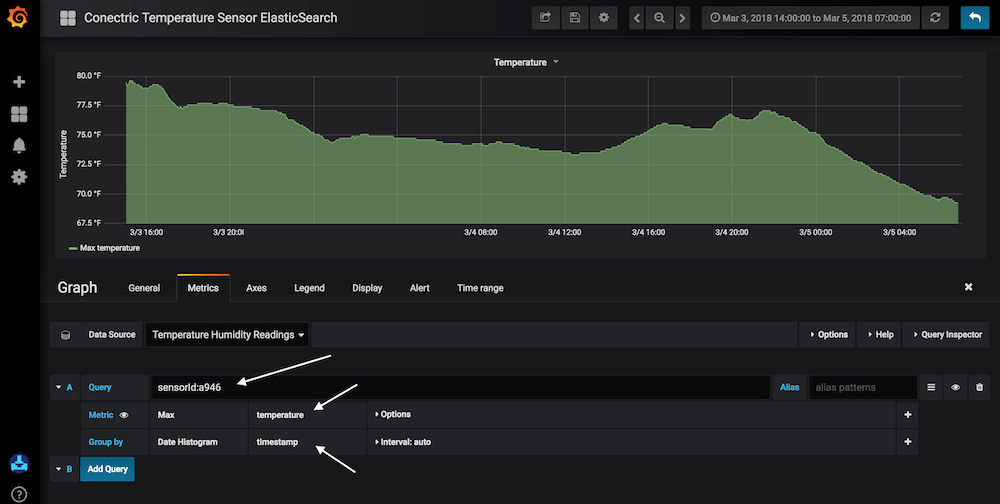
- Query: the Lucerne query to get the data from Elasticsearch, here we’re showing values from sensor
a946. - Metric: Set to
Maxas we want to show the highest temperature recorded at each time interval.temperatureis the name of the data key in Elasticsearch to show data from. - Group By:
timestamp— tells Grafana where the time series key is in Elasticsearch. These are the UNIX timestamp values for each sensor message generated by the Conectric SDK.
Demo Time!
We’ve now got everything we need to track temperature and humidity over time in Elasticsearch… First set the environment variables to the values obtained when the Elasticsearch cluster was established. Next start the gateway script server.js:
export ELASTICSEARCH_URL=https://...
export ELASTICSEARCH_USER=elastic
export ELASTICSEARCH_PASSWORD=pass...
export ELASTICSEARCH_PORT = 9200
npm start
Insert the Conectric router into an open USB port, install the battery in the temperature sensor and watch it start reporting data…
The sensor periodically sends a tempHumidity message which is picked up by the router from the mesh network and decoded by the Node.js SDK. The callback function writes this to Elasticsearch, and the Grafana dashboard polls Elasticsearch and updates as the data arrives over time.
After a period of time to gather data, the dashboard will show trend and peak information:
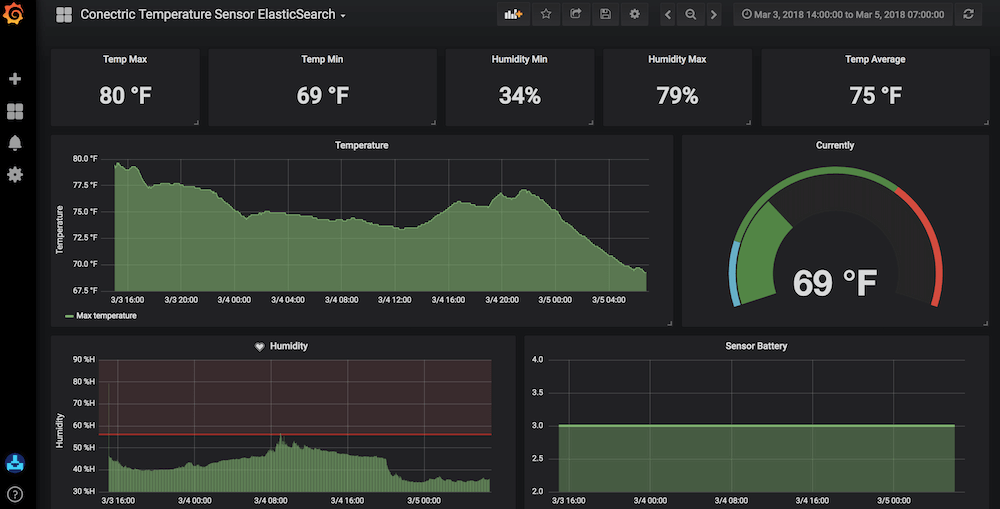
As we can see it is very straightforward to integrate with the Conectric temperature sensor and SDK, requiring minimal custom coding work. The Conectric SDK for Node.js is designed from the ground up to enable you to embed our scalable mesh network and reliable low maintenance sensors into your own product, platform or other solution.
All Conectric software including the example code referenced in this article ships under the terms of the MIT License allowing you to use it for your own purposes.
We’re really excited about the possibilities that this product opens up for developers and systems integrators alike. We hope that you are too!
 Door Open Alerts with Twilio and Conectric's IoT Sensor Product for Node.js